Predicting the U.S. Presidential Election Using Only 'High-Quality' Polls and a Pro-Trump Midwest Bias
The model forecasts a tight race with Kamala Harris slightly ahead

(Update November 5, 2024: The final model predictions are here)
The quality of polling has become a contested issue since 2016, after Donald Trump won the Presidency against all odds. In 2020, Trump again performed better than predicted by polls. Especially in the Midwestern swing states Michigan, Pennsylvania, and Wisconsin, polls significantly underestimated Trump in both elections, given rise to hopes of Trump supporters and concerns among his opponents that 2024 will play out like 2016.
While polling in the previous two election cycles suggested Democrats were clear favorites, the current picture is different: Polls now predict a close race, and prediction models using these polls essentially forecast a coin flip. Betting markets increasingly see Trump as the favorite, likely due to both close polling and the expectation of a similar polling error to what occurred in 2016 and 2020. However, some Democrats argue that Trump's recent improvement in the polls is driven by Republican-aligned pollsters deliberately "flooding the zone" with polls favorable to Trump, thereby skewing polling averages and making the race seem closer than it is.
In response to these concerns, The Washington Post bases its polling averages only on polls it considers “high quality” — those that are transparent about their methodology and have a track record of accuracy. This doesn't necessarily exclude agencies with a political bias, as outlets like Fox News and CNN are still included. Similarly, FiveThirtyEight ranks pollsters based on such criteria and introduces polling weights accordingly.
I have tried to account for both the concerns that Trump may again be underestimated in the Midwest and the possibility that some polls are biased in his favor. I created a “high-quality prediction model with a Midwestern Trump bias.” This model includes only recent polls deemed high quality while adding a pro-Trump bias in Michigan, Pennsylvania, and Wisconsin.
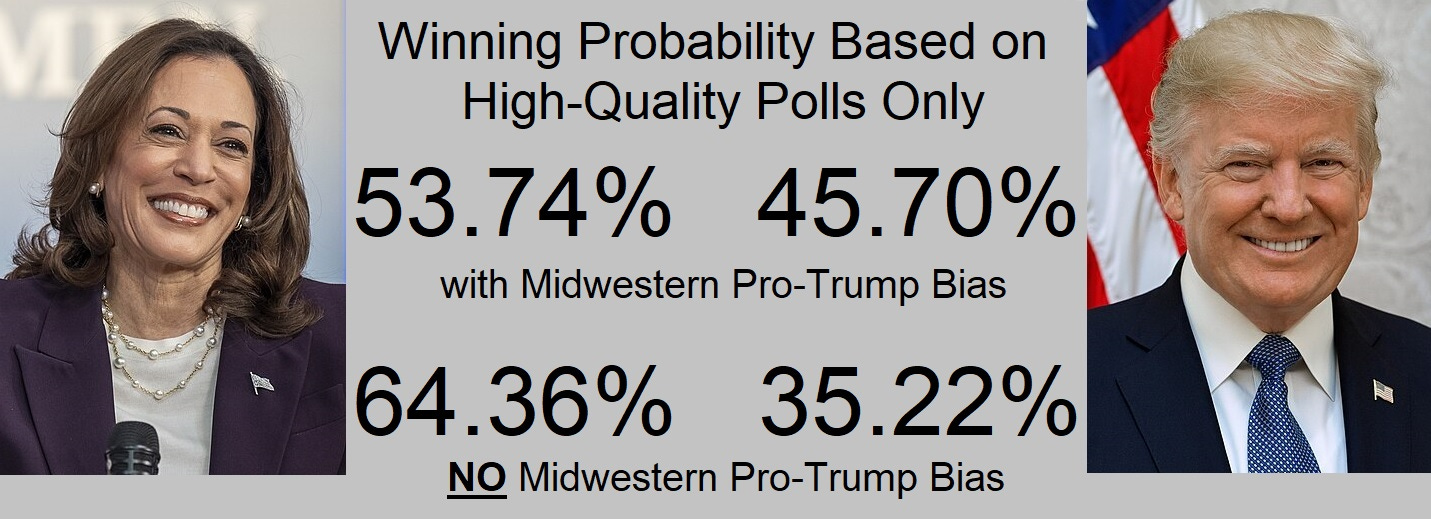
The TL;DR is that the model responds strongly to new high-quality state polls leading up to the election. The model currently estimates the probability of a Kamala Harris victory at 53.74%, factoring in the pro-Trump bias in the Midwest. This is a coin flip similar to other prediction models, but her probability would jump up to 64.36% if we remove the bias, highlighting the importance of accurate polling in the Midwest for the Presidential race.
I believe that the model is generally useful for two reasons: First, particularly when removing the pro-Trump bias, the model could be considered at the moment as a best/worst case scenario for Democrats/Republicans, offering a benchmark for expectations. Second, the election, which is now less than two weeks away, will provide a test of the model’s accuracy, helping us evaluate how much we can trust “mainstream experts” (in comparison to poll aggregators or pro-Trump polls) in determining which polls are truly high quality.
Here are all current (October 24) predictions of the model. More information on the model specifications is below:
Electoral College:


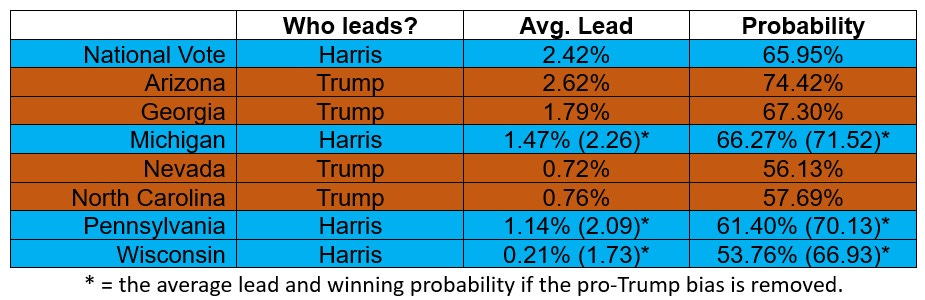
National vote and battleground states


Model specifications
As typical for predictive models, I use a simulation-based approach (with 10,000 simulations) because it allows for a wider range of potential outcomes and allow the model to show the probabilities of election outcomes. It is rather a simple model drawing mostly on polling data on the state and national level while making only a few assumptions on the election outcome (e.g. capping possible percentages to ensure a relatively close contest in battleground states, excluding third-party candidates and unsure voters from the analysis).
While the model assumes that all included polls do not differ in their quality, I still use the product of two different weights for each poll. The first weight is based on the sample size. Here I use the square root of the sample size divided by 600. Many state polls have 600 respondents or approximate it, which also has a margin of error of 4%. The higher the sample size, the stronger the weight of the poll. The second weight takes into account that more recent surveys should have a stronger impact in the model. This is achieved by employing a declining linear trend. In addition, no surveys taken before September are used, except for Nevada where there is a particular lack of high-quality polling.
Lastly, the pro-Trump bias in the Midwest is a dynamic measurement based on trends in national polls. To calculate it in a simplified way, I first determined the average difference between the candidate’s vote share in Michigan, Pennsylvania, and Wisconsin and their national vote share in the 2016 and 2020 elections. This discrepancy is then adjusted based on the current average of the national polls, and the remainder is applied as a pro-Trump bias in each state poll. For example, the average discrepancy between Wisconsin and the national election for the 2016 and 2020 elections (standardized two-candidate election) is 3.45 percentage points. Harris is currently leading the national average by 2.56, resulting in a pro-Trump bias of 0.89 percentage points in Wisconsin.