Non-Stop Winning for the Trump Model
How My "Trump Partisan Polls Only" Model Outperformed Polymarket and Other Prediction Models in the US Presidential Election

It happened again: For the third consecutive time, polls underestimated Donald Trump. However, unlike in 2016 and 2020, the deviation was smaller this time and often within the margin of error. Prediction models viewed the race as a coin toss, highlighting that even minor polling deviations could have easily led to a sweep of key swing states for either candidate. Consequently, Trump’s victory was not unexpected and did not represent a major failure for public opinion polling.

Nevertheless, polling practices and accuracy raised concerns before the election in three main areas: First, Democrats argued that pro-Trump partisan pollsters were "flooding the zone" with low-quality polls. Second, there were accusations that pro-Trump capital artificially inflated Trump’s odds on the betting page Polymarket in an attempt to boost the crypto market, given Trump’s image as a pro-crypto candidate. Third, many pollsters engaged in “herding,” clustering their results around the polling average to align with other forecasts. As a result, standard prediction models, which are essentially weighted averages of all polls, suggested a 50:50 race with limited shifts for weeks leading up to the election.
To address these issues, I developed two distinct prediction models: one based on polls deemed “high quality” by mainstream media like the Washington Post, and another relying solely on polls accused of being partisan and pro-Trump. This disaggregation aimed to test the “flooding the zone” hypothesis and provide benchmarks for different partisan perspectives.
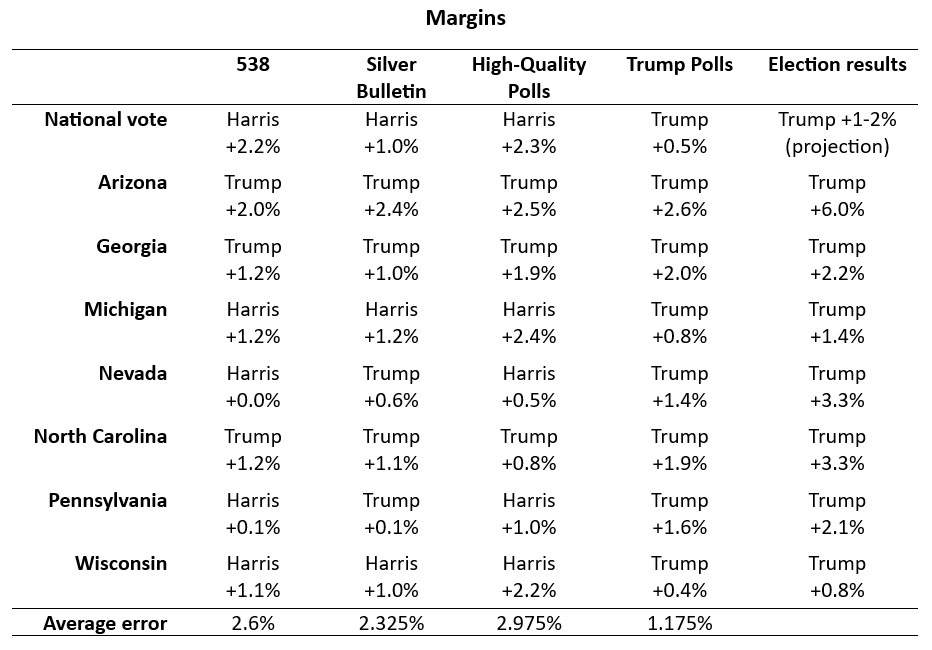
Unlike the standard prediction models, my two-model approach revealed clear opposing dynamics. The “high-quality polls only” model predicted a Harris victory with a 61.5% probability, while the “Trump partisan polls only” model showed Trump winning with a 73.2% probability, sweeping the battleground states. Clearly, the pro-Trump polls outperformed the so-called high-quality polls. Additionally, the Trump model surpassed the accuracy of Nate Silver, the FiveThirtyEight model and Polymarket.
Performance Comparison
The preliminary results, pending final ballot counts (especially for the popular vote and Arizona), show that for the national vote and all battleground states, the “pro-Trump partisan polls only” model performed the best. Its average error for the margins was just 1.175% (underestimating Trump), compared to 2.325% for Nate Silver’s model, 2.6% for the 538 model, and 2.975% for the high-quality polls model. In 2020, polling errors against Trump in swing states were nearly double this margin, underscoring the improvement.
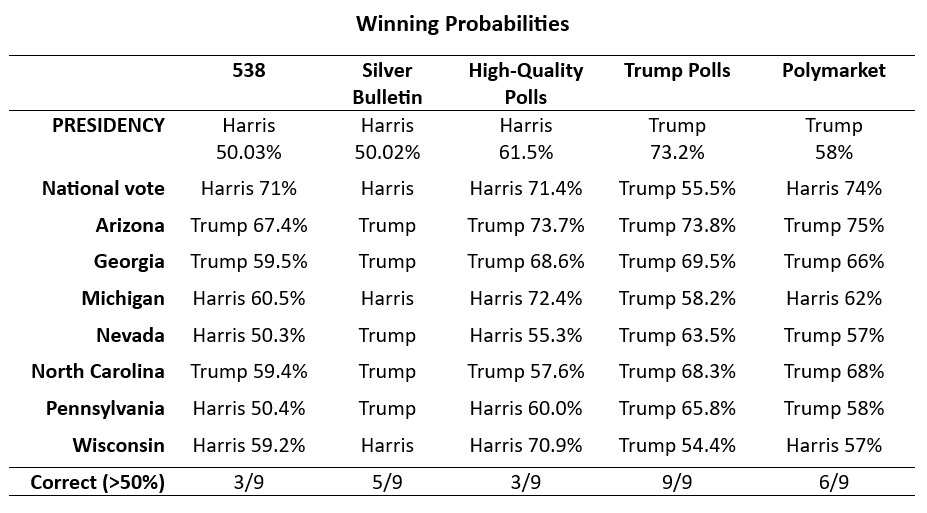
In terms of correct predictions, the Trump model was flawless, accurately predicting the overall winner, national vote, and all swing states. Polymarket, now praised by some for its accuracy, had six correct predictions, followed by the Silver Bulletin with five, and both the FiveThirtyEight model and the high-quality polls model with three correct predictions.
Previously, I also introduced a third model: the “high-quality polls only with a pro-Trump Midwest bias” model. This accounted for previous underestimations of Trump’s support in Midwest swing states in 2016 and 2020. While this model obviously performed better than the standard high-quality polls model, its core assumption did not hold, as Trump did not outperform his national result in the Midwest in this election.
Conclusion
The results of this election reaffirm the persistent underestimation of Trump’s support in mainstream polling. The success of the Trump Partisan Polls Only model demonstrates that alternative approaches, especially those accounting for partisan dynamics, can yield more accurate predictions. As polling practices continue to evolve, distinguishing and disaggregating between different types of polls may be crucial for future forecasting.